Resource Monitoring
Resource Monitoring lets the AI Assistant use live metrics and health signals from the monitoring stack you connect. Depending on your environment (for example IBM VPC or on-premise), the wizard shows different tools and requirement forms.
Metrics Commonly Monitored
- CPU usage — Utilization, load averages, throttling.
- Memory utilization — Used vs available, swap, OOM risk signals.
- Disk performance — Latency, IOPS, capacity, filesystem health.
- Network activity — Throughput, errors, saturation on key interfaces.
Exact metric sets depend on the tool, region, and what you expose to Wanclouds AI.
Benefits
- Infrastructure health insights — Faster answers to “is this host healthy?” in chat.
- Performance monitoring — Trend and spike detection when historical data is available.
- Early anomaly detection — Combine thresholds and AI summarization to catch drift before user impact.
Enabling Resource Monitoring
On Step 2: Capability Configuration, open Add Capabilities & Connect Data Sources, then enable Resource Monitoring. The card explains that you are connecting monitoring (and related) tools so the assistant can reason over infrastructure data.
The subtitle under the capability reflects your assistant’s environment—for IBM VPC connectors you will see Monitor IBM VPC infrastructure. Under Requirements, the required field Select Tool uses a dropdown; choose the integration that matches where metrics live.
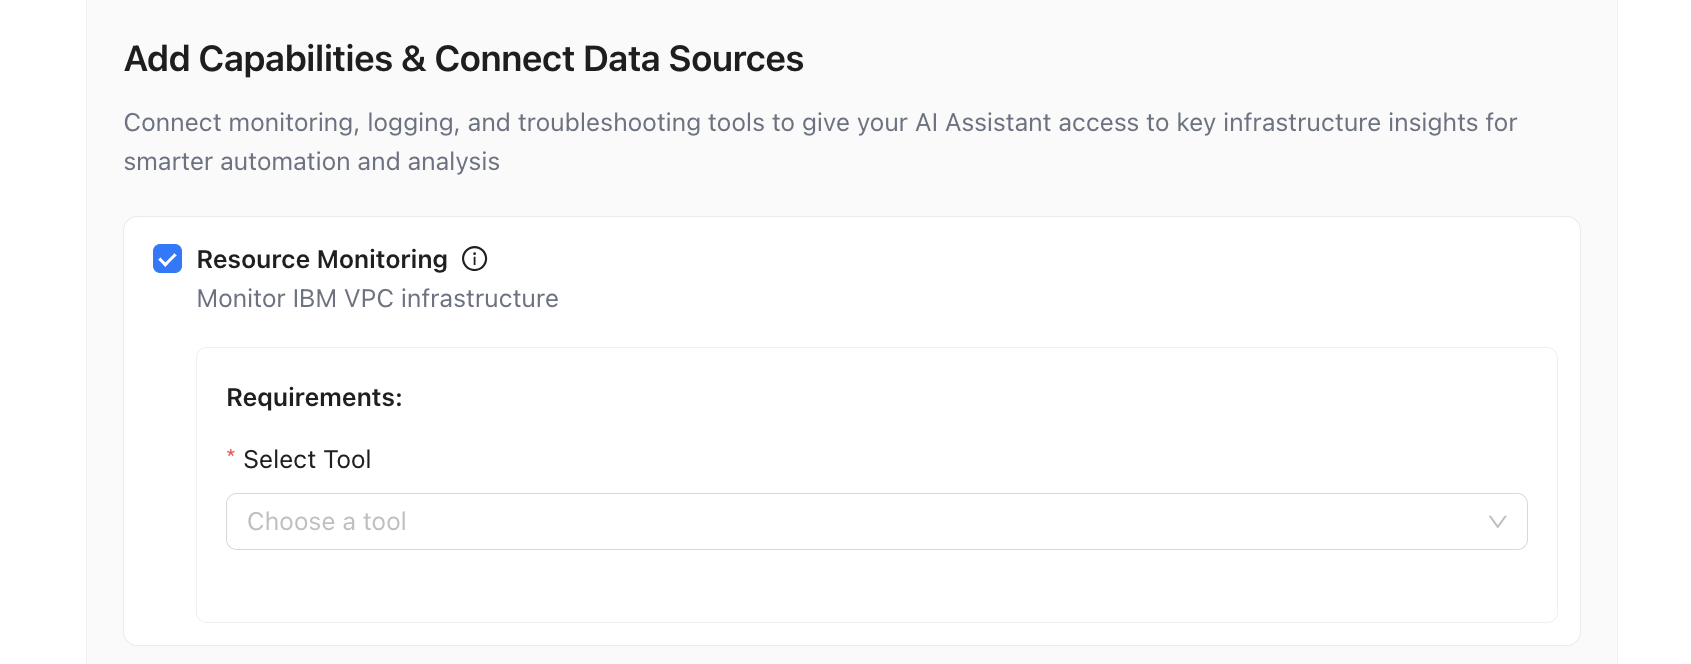
After you pick a tool, the form below updates. The following sections describe each option in detail.
IBM Cloud Monitoring
IBM Cloud Monitoring connects the assistant to IBM Cloud’s monitoring service (Sysdig-backed monitoring in IBM Cloud) for resources in your VPC.
When to Use It
Use this when your assistant’s environment is IBM VPC and you want queries and insights against IBM Cloud Monitoring metrics for that account—in one region or several, using + Add Token to register each region’s token.
What You Configure
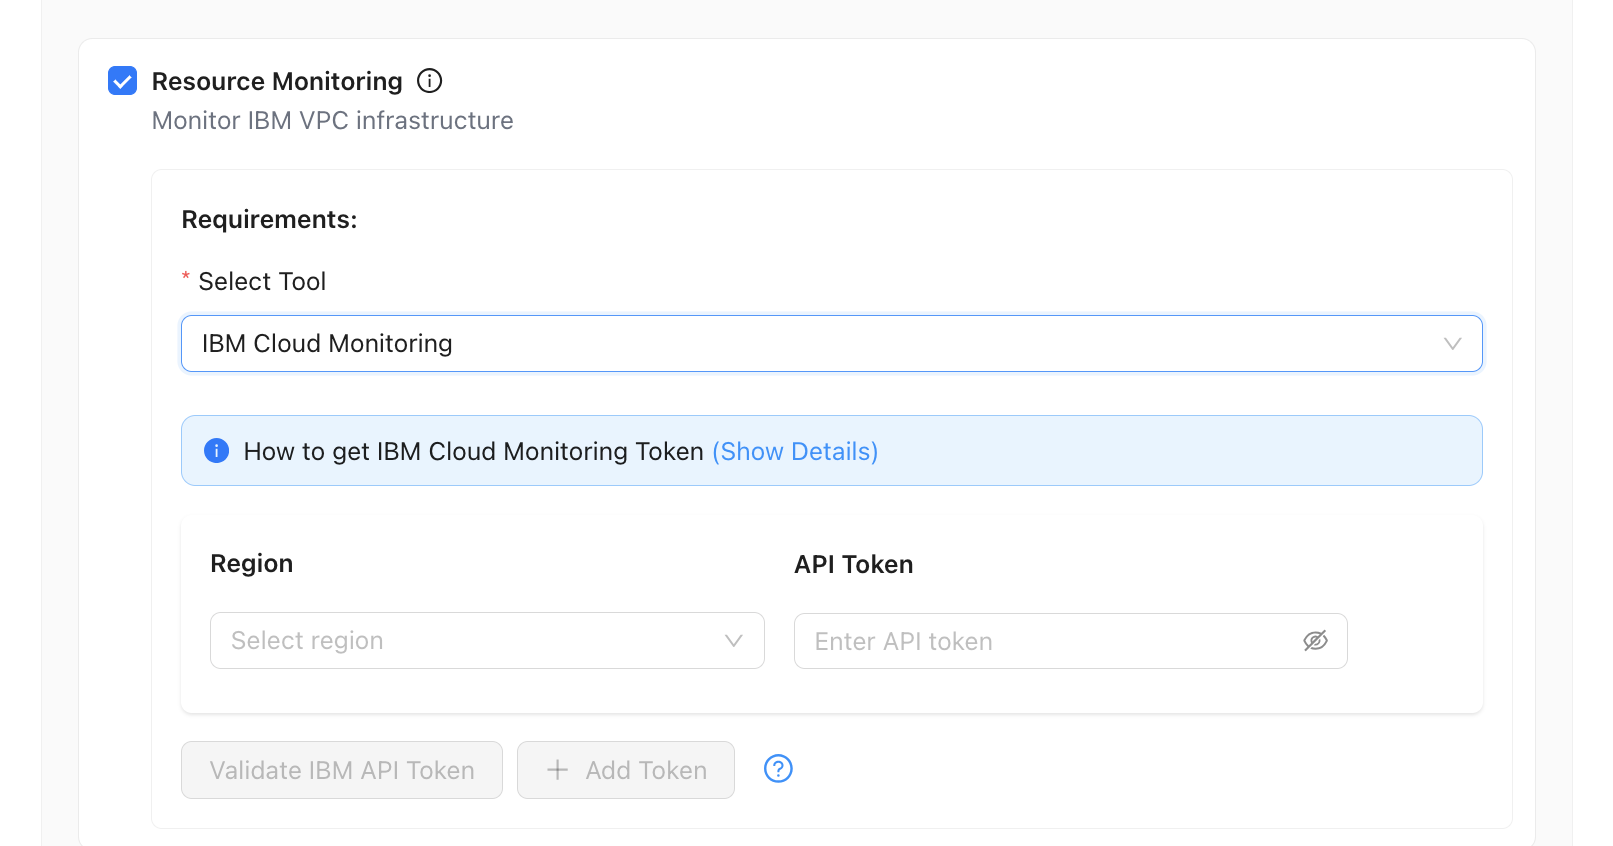
- Select Tool — Choose IBM Cloud Monitoring.
- Region and API token — IBM Cloud Monitoring is region-scoped. For each region and token pairing you configure, pick a region, then enter the API token that applies to monitoring in that region. Tokens are not interchangeable across regions: use the correct token for each region you add. Use the token field’s show/hide control when entering secrets.
- How to get IBM Cloud Monitoring Token — Use Show Details on the blue info banner for steps to create or locate tokens in the IBM Cloud console.
- Validate IBM API Token — Confirms the currently selected region and token together (IBM’s monitoring API is called in the context of that region). Complete the required fields for that pairing before validating.
- + Add Token — Adds another region selector and API token field so you can register an additional region. Use this when workloads span multiple IBM Cloud regions so the assistant can query monitoring in each region you configure. Repeat validate as needed for each pairing your process requires.
You can keep several region + token pairs on the same assistant so one AI Assistant can reason over metrics from more than one region.
Validate each region and token pair you care about. A mismatched token for a region—or skipping validation—can lead to empty or misleading answers in chat for that region.
Prometheus (Via MCP Endpoint)
Prometheus is wired through an MCP (Model Context Protocol) server that fronts your Prometheus API. The assistant talks to that MCP endpoint so it can query metrics in a controlled way.
When to Use It
Use this when metrics are in Prometheus (or a compatible stack) and you operate an MCP server that exposes Prometheus query access to Wanclouds AI.
What You Configure
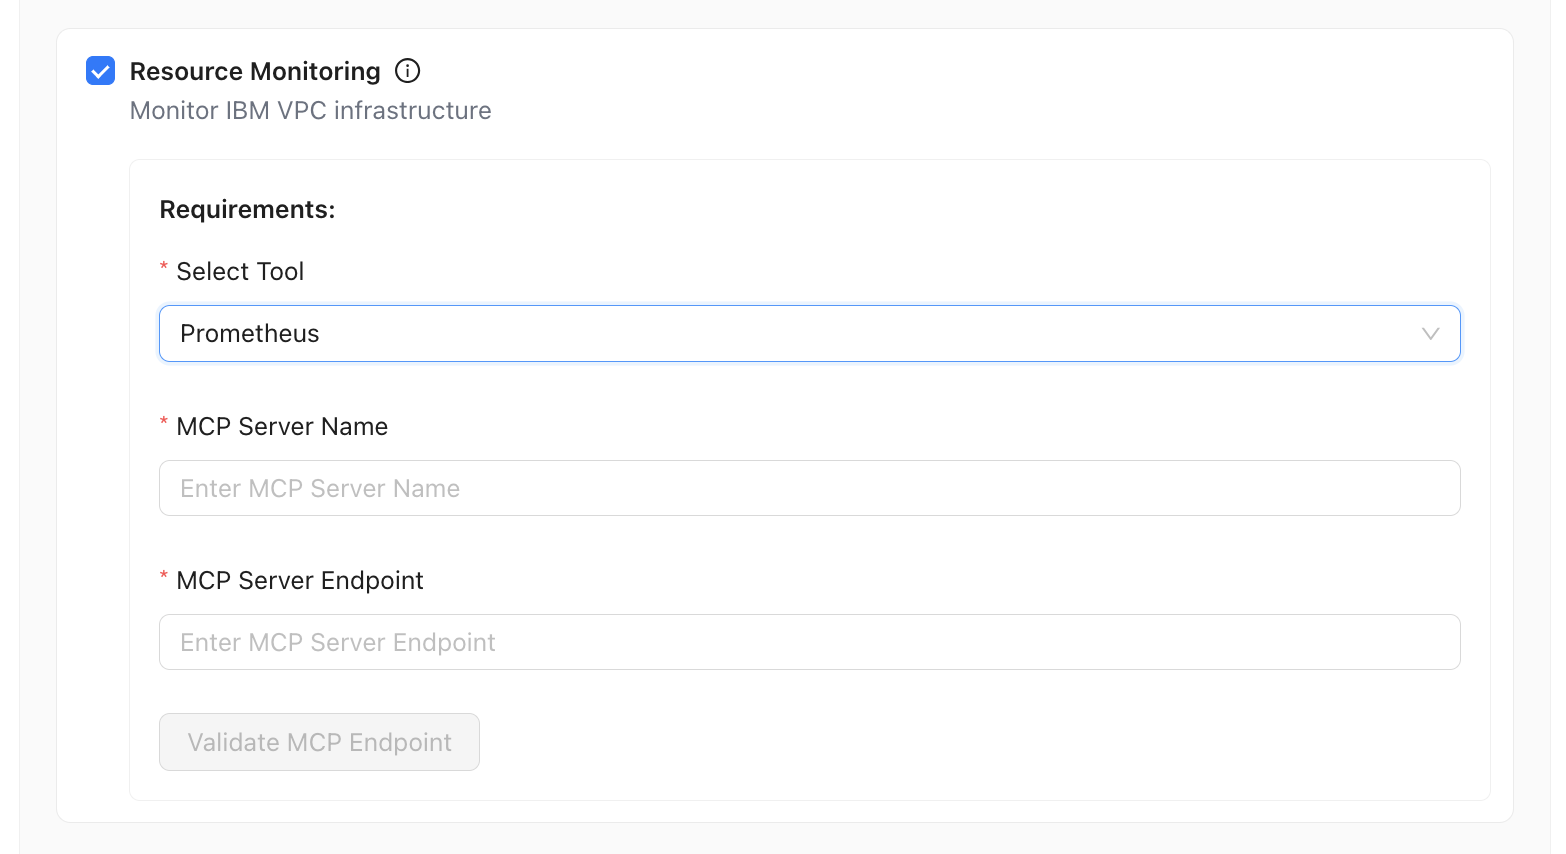
- Select Tool — Choose Prometheus.
- MCP Server Name — A label you assign so you can recognize this endpoint in lists and logs (required).
- MCP Server Endpoint — The base URL (or address) where the MCP server is reachable from Wanclouds AI’s network path—typically
https://orhttp://plus host and path, as your deployment requires. - Validate MCP Endpoint — Runs a connectivity and handshake check. The control stays disabled until name and endpoint are filled; fix DNS, TLS, or firewall issues if validation fails.
Here MCP means the Model Context Protocol integration pattern used by Wanclouds AI—not a generic “multi-cloud” label. Your platform team may host or approve the MCP server that bridges Prometheus.
Zabbix
Zabbix uses connectors you have already defined (or add on this screen). Each connector points at a Zabbix frontend URL the platform can use to integrate with your Zabbix deployment.
When to Use It
Use this when your authoritative metrics and triggers live in Zabbix and you want the assistant to reason over hosts, items, and problems from that instance.
What You Configure
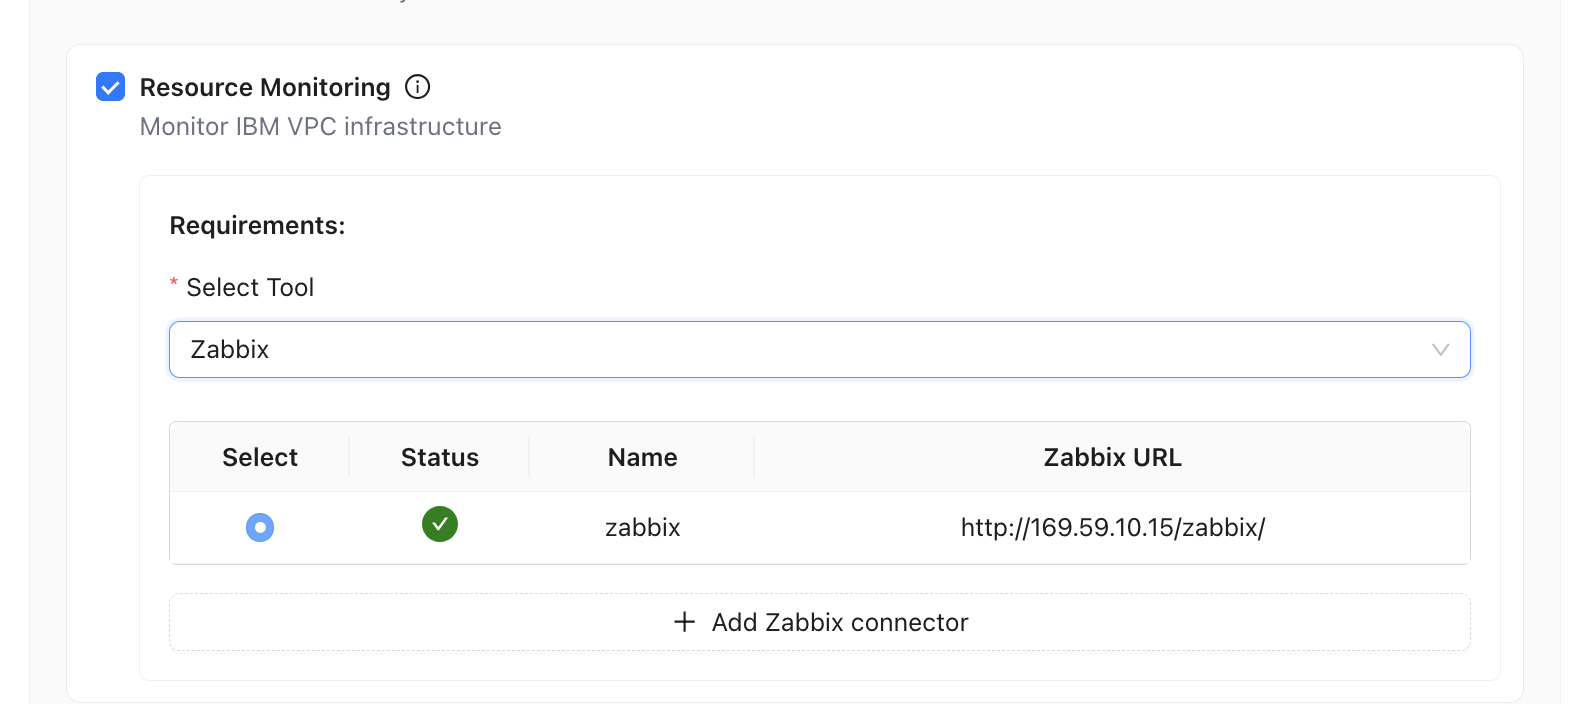
- Select Tool — Choose Zabbix.
- Connector list — A table shows Name, Status, and Zabbix URL for each connector.
- Select — Pick one connector (radio) for this assistant’s monitoring context.
- Status — A green check indicates the connector is healthy; prefer validated connectors.
- Zabbix URL — The web UI base (for example
http://host/zabbix/) used for this integration.
- + Add Zabbix connector — If the right instance is missing, add a new connector and complete its setup, then return and select it.
You choose one monitoring tool in Select Tool for this capability block. If you need both Zabbix and Prometheus, that usually means separate assistants or additional integrations—follow your admin’s guidance.
Configuration Flow (Summary)
- Environment & connector — Complete Step 1 so the assistant knows whether you are on IBM VPC, on-premise, etc.
- Enable Resource Monitoring — Step 2 → check Resource Monitoring.
- Select tool — IBM Cloud Monitoring, Prometheus, or Zabbix (other tools may appear depending on product version).
- Complete tool-specific requirements — Tokens, region, MCP endpoint, or Zabbix connector as above; validate where the UI offers it.
- Save the assistant and use chat scoped to that assistant for metrics questions.
Relationship to MCPs and Other Capabilities
- Prometheus in this wizard is explicitly MCP-endpoint–based. Global MCP catalog items may still apply for other data sources; see MCPs.
- Pair Resource Monitoring with Log Analysis or Intelligent Troubleshooting when you want metrics plus logs or SSH-backed diagnosis.
Related Topics
- AI Assistant Overview
- Environment Setup & Connectors
- Intelligent Troubleshooting — From alerts to deeper diagnosis.